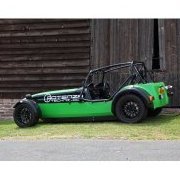
Sport E Dyno Results and Electric Power
I'm busy rebuilding the battery pack with half the battery cells to reduce weight. While this is ongoing I thought I might share my dyno results from last year and talk a bit about electric power verses petrol power.
The following graph shows power and torque against road speed. Remember the car has no gearbox. The motor is directly coupled to the diff. You can see that the graph ends at about 80mph. This was due to a software speed limit bug which was fixed before the sprint events. I have added dotted lines to show how the graph should look. Actual top speed is about 110mph. In any event you can see the flat torque curve starting from zero speed and then progressively reducing once the power limit is reached. The power limit of 120KW (from the battery) is reached at 53mph and is constant until just before 110mph.
The manufacturers quoted figure for electric cars is usually the battery discharge power. This is easy to measure since it is just battery amps multiplied by battery volts. The Westfield peak battery discharge figure is 120KW or 160bhp. But - the dyno graph shows actual power delivered at the wheels to be 118bhp or 88KW!!
Although electric drive trains are more efficient than petrol engines they are still inefficient. Petrol engines achieve about 33% efficiency, by comparison the electric motor and power controller combination are together about 80% efficient. Thus 160bhp x 0.80= 128bhp. Add the differential and tyre inefficiencies and 118bhp at the wheels seems about right. It turns out this is typical for electric vehicles at full power. In general you can take the published electric car 'power' in KW and convert it to bhp at the wheels directly. So a 100KW car is probably putting out about 100bhp at the wheels. Overall, motor efficiency is strongly affected by the motor speed and load and can get up to 95%( ish) under mid range loads and speeds and down to 65% at low speed and high torque.
As the graph shows, above 53mph, full power is always available. Conversely, below 53mph power is progressively lower but torque is constant. Thus on short circuits like Curborough max power is seldom reached. The 0-60 time is unimpressive at 7.5 seconds but once up to full power the car really seems to accelerate relentlessly. It's a bit like driving in top gear all the time. Also, unlike most electric road cars, the Westfield accelerates through 80 mph at full power. This makes the car feel much more responsive at high speed than most EVs since these are usually speed limited to about 85mph. The Tesla is an exception to this.
It's also worth noting that the Westfield is continuously rated at these power and torque levels. The battery was designed for the 200KW Westfield iRacer and the motor is good for another 47KW with a peak of 167KW. Most 'fast' electric car manufacturers will over drive the motor and battery for short durations to get the rapid acceleration they are known for. Push these cars too hard and the torque output will automatically limit to prevent overheating. It would be interesting to try a Nissan Leaf or a Tesla around a racetrack to test this. I suspect most EVs would start to limit well before the end of a lap - including the Tesla.
Since the Westfield Sport E electrical power system is not stressed when raced there appears to be considerable scope to tune this car for higher performance.
-
 3
3


8 Comments
Recommended Comments